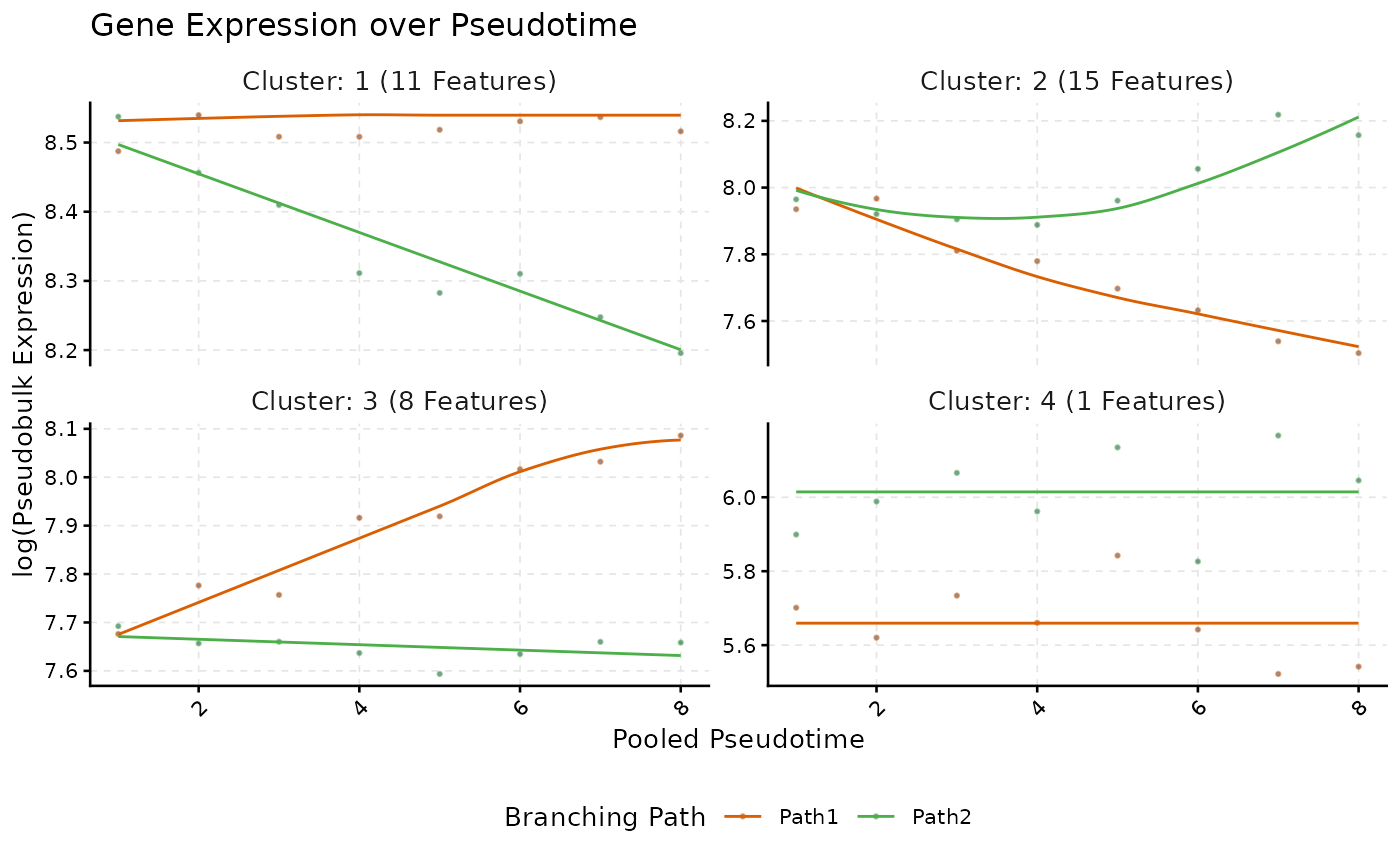
plotTrendCluster() plots, in one panel per cluster of
sc.cluster.trend(), the points of its genes along the binned pseudotime
and a loess curve per path through their fitted curves.
Usage
plotTrendCluster(
  scmpObj,
  xlab = "Pooled Pseudotime",
  ylab = NULL,
  summary_mode = "median",
  logs = NULL,
  logType = "log",
  smoothness = 1,
  verbose = TRUE,
  pseudoCount = 1,
  significant = FALSE,
  curves = TRUE,
  lines = FALSE,
  points = TRUE,
  loess_span = 0.8
)
Arguments
- scmpObj
A ScMaSigPro object.
- xlab
The label of the x axis.
- ylab
The label of the y axis. The default,
NULL, is"log(Pseudobulk Expression)"for log-link fits and when the points are logged, and"Pseudobulk Expression"otherwise.- summary_mode
How the points of each binned pseudotime and path are summarised for the lines:
"median"or"mean".- logs
Whether to log the points, as in
plotTrend(). The default,NULL, logs them when the fits used the log link.- logType
The log of the points:
"log","log2"or"log10".- smoothness
The step of the pseudotime grid of the curves: the smaller, the smoother.
- verbose
Whether to print progress messages.
- pseudoCount
The number added to the points before the log.
- significant
Whether the genes must be in a gene list of
sc.filter(); the others are left out with a warning.- curves
Whether to draw the fitted curves.
- lines
Whether to draw lines through the points.
- points
Whether to draw the points.
- loess_span
The span of the loess curves.
See also
Other plots:
plotBinTile(),
plotDiagnostics(),
plotIntersect(),
plotTrend()
Author
Priyansh Srivastava spriyansh29@gmail.com
Examples
data("scmp.ob", package = "scMaSigPro")
plotTrendCluster(scmp.ob, verbose = FALSE)