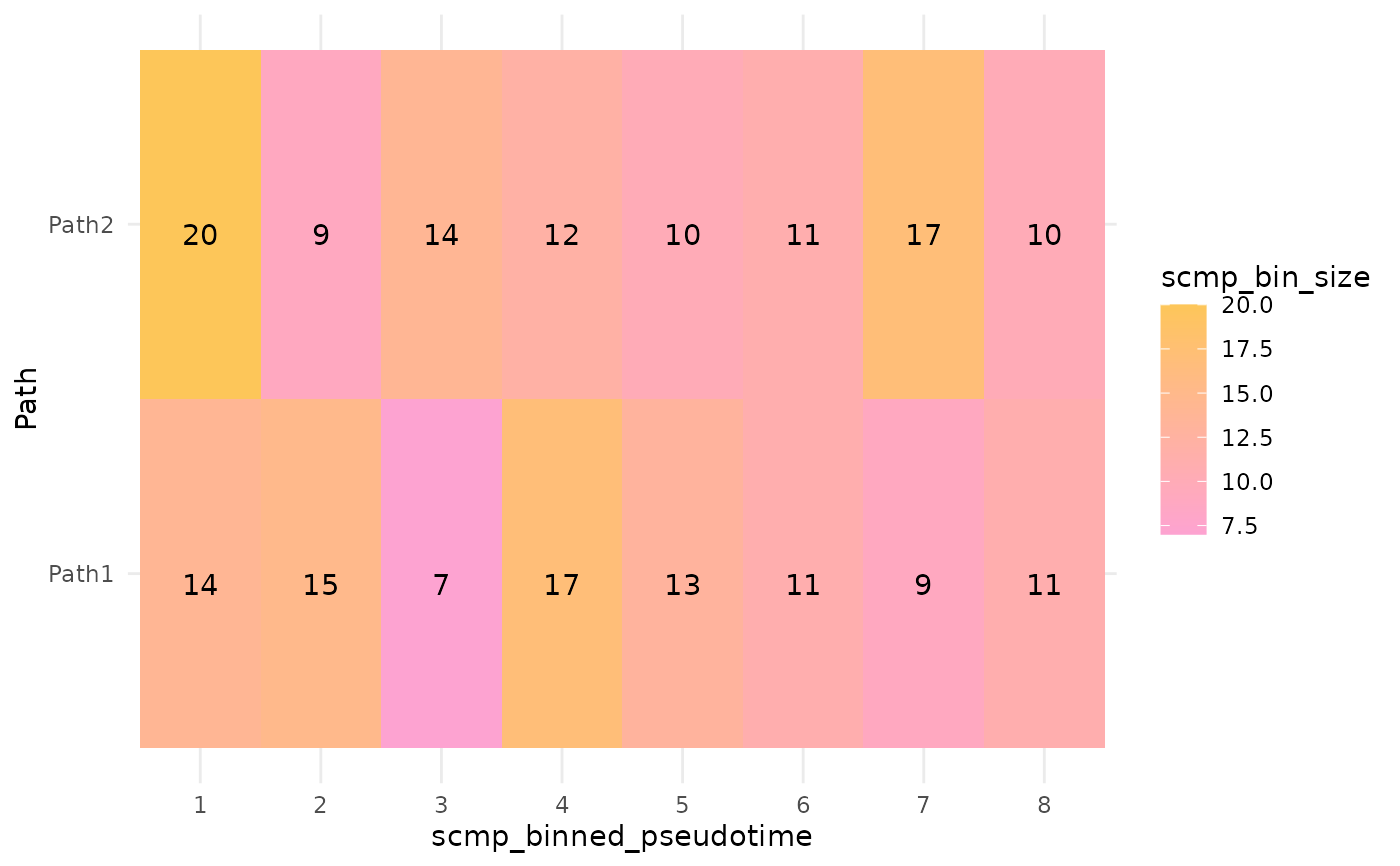
plotBinTile() draws a tile for each bin, by path and binned pseudotime,
coloured and labelled by its number of cells.
Usage
plotBinTile(
  scmpObj,
  path_col = scmpObj@Parameters@path_col,
  bin_size_col = scmpObj@Parameters@bin_size_col,
  bin_ptime_col = scmpObj@Parameters@bin_ptime_col
)
Arguments
- scmpObj
A ScMaSigPro object.
- path_col
The name of the column of the cell or bin metadata that holds the path label of each cell or bin.
- bin_size_col
The name of the column of the bin metadata that holds the number of cells of each bin.
- bin_ptime_col
The name of the column of the bin metadata that holds the binned pseudotime of each bin.
See also
Other plots:
plotDiagnostics(),
plotIntersect(),
plotTrend(),
plotTrendCluster()
Author
Priyansh Srivastava spriyansh29@gmail.com
Examples
data("scmp.ob", package = "scMaSigPro")
plotBinTile(scmp.ob)