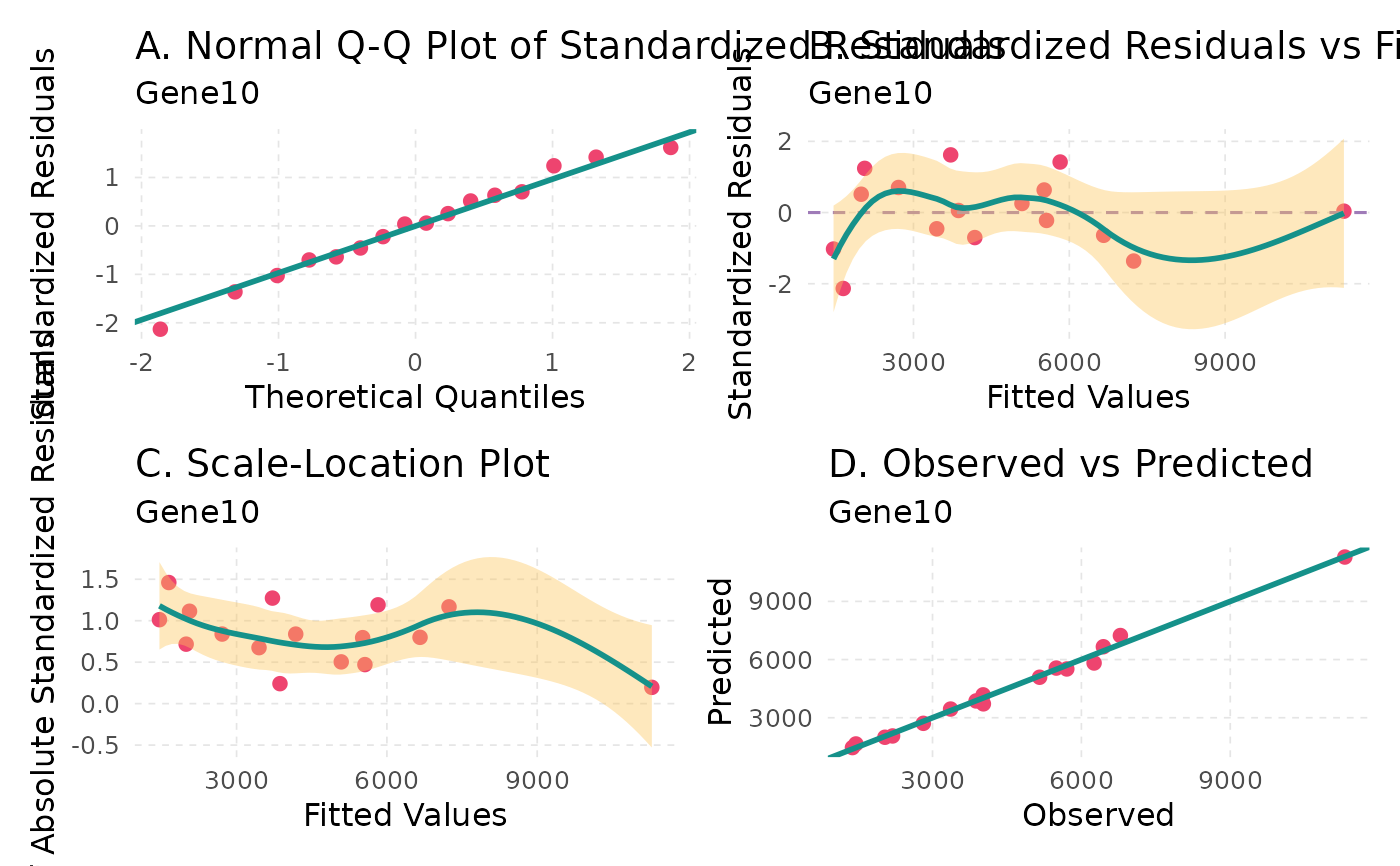
plotDiagnostics() draws four diagnostic plots of a model of a gene of
the gene lists of sc.filter(): the normal Q-Q plot of the standardised
residuals, the standardised residuals and their square root against the
fitted values (scale-location), and the observed against the predicted
counts.
Arguments
- scmpObj
A ScMaSigPro object.
- feature_id
The name of a gene.
- model
The model:
"optimized", the model selected bysc.t.fit();"full"; or"intercept", the intercept-only model.
See also
Other plots:
plotBinTile(),
plotIntersect(),
plotTrend(),
plotTrendCluster()
Author
Priyansh Srivastava spriyansh29@gmail.com
Examples
data("scmp.ob", package = "scMaSigPro")
if (requireNamespace("patchwork", quietly = TRUE)) {
    plotDiagnostics(scmp.ob, "Gene10")
}